Helping participants improve their AI Bots
The SmartBots Coding Challenge invited developers to build an AI bot for a card game. As organizers, Bhoos Games required a platform to onboard the participants and keep them engaged.
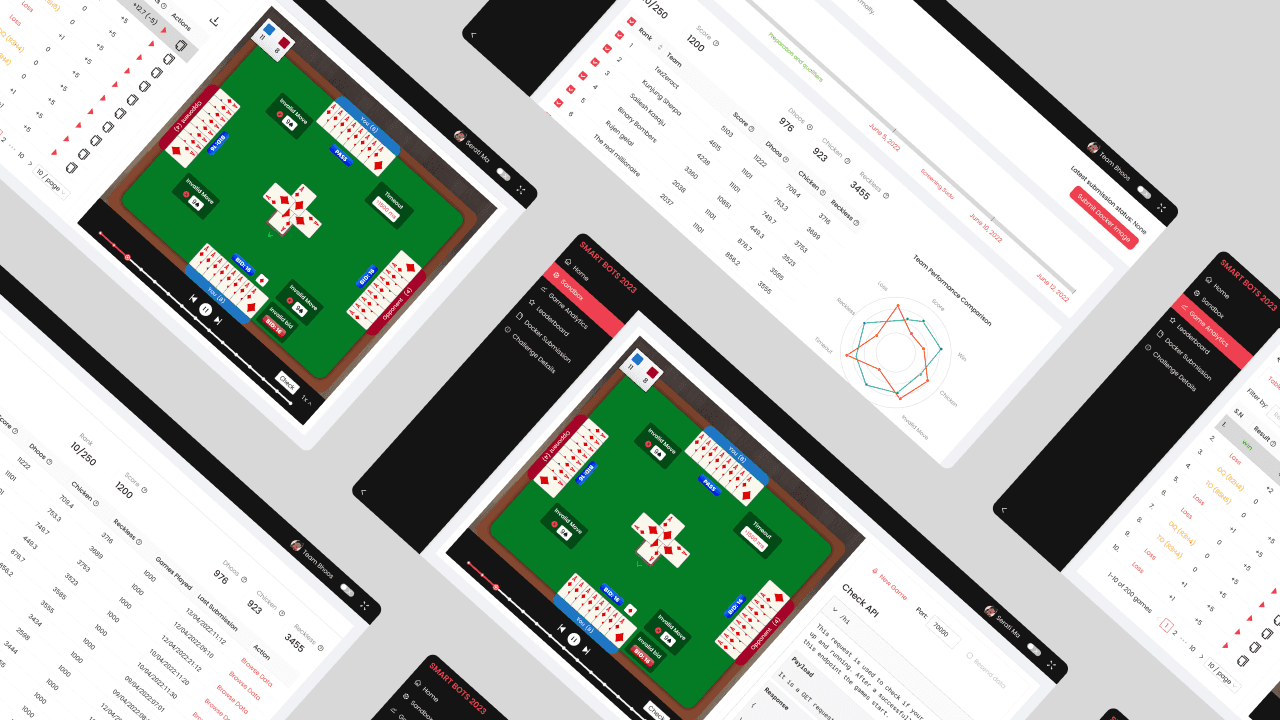
I help design a centralized dashboard used by 870 participants across 725 teams to “see” their bots in action, track their performance, and improve their bots.
Timeline
2022 | 6 months
The Team
Back-end Developer, Front-end Developers, Content Writer
My Role
UI/UX Design
What was required?
The Coding Challenge required a platform to onboard participants, engage them throughout the challenge and provide them a way to “see” their bots in action to debug and improve them.
What did I do?
I was given the requirements primarily by the technical leads, with my contributions focusing on clarifying them through discussions.
I lacked direct access to participants during the design phase so I relied on feedback from the internal developers who were building the platform to validate design decisions.
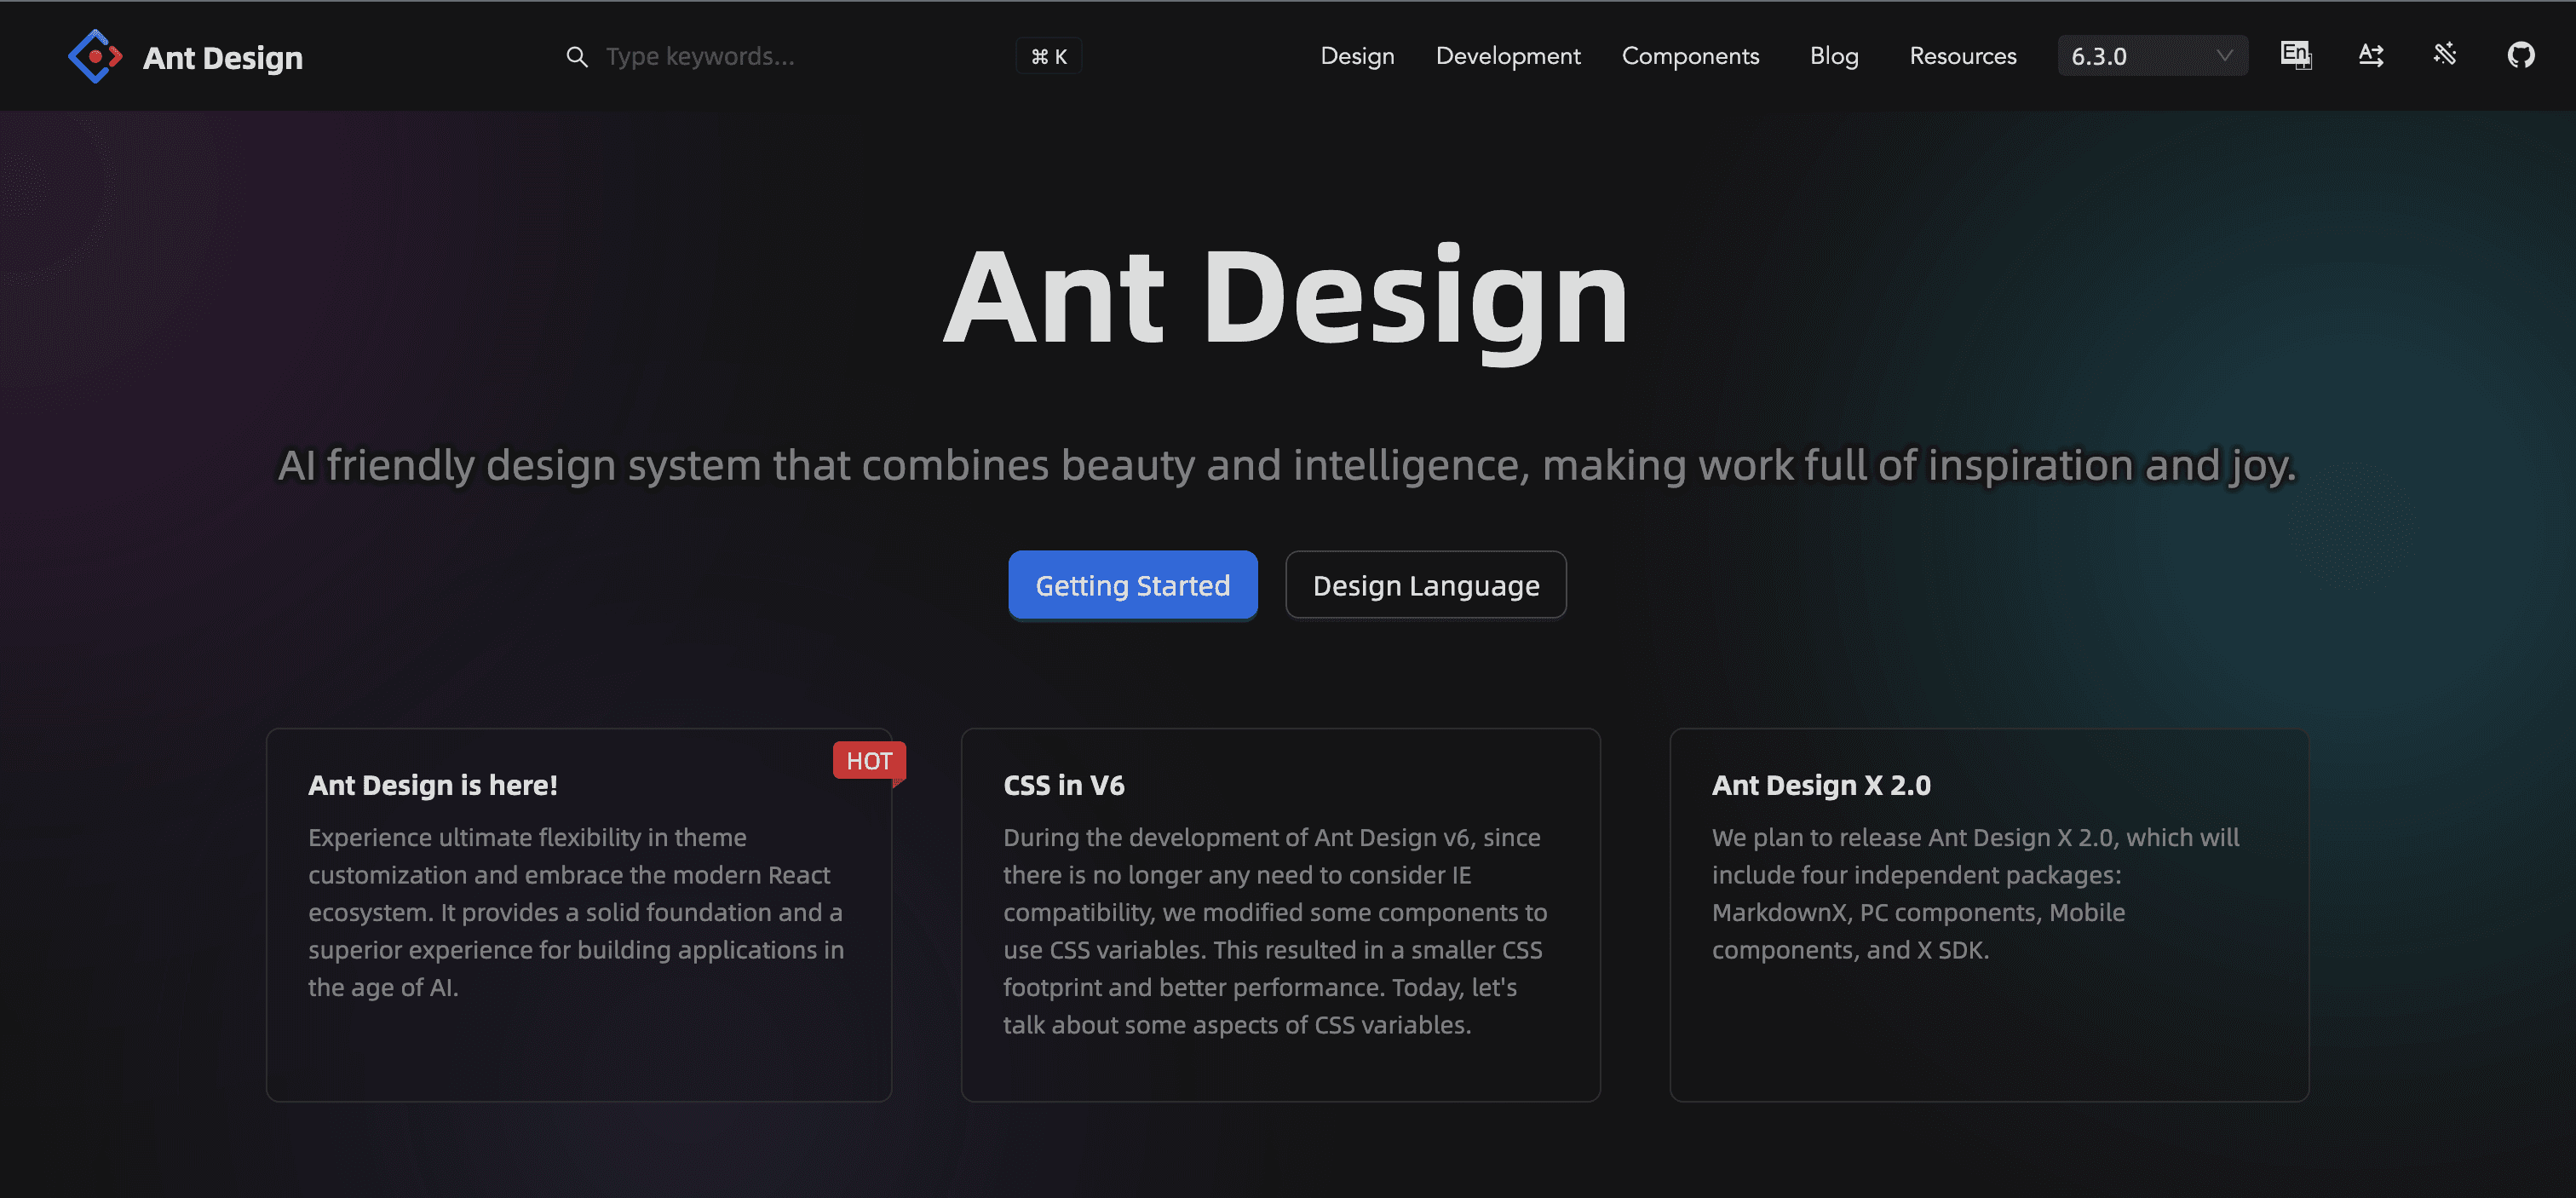
Ant Design is an open-source design system that primarily provides a UI components for React.
To ensure rapid development, we chose the Ant Design System. My role was not just to "use" it, but to customize it to our requirements. I customized the colors to match the brand and tweaked specific components to fit the dashboard's needs.
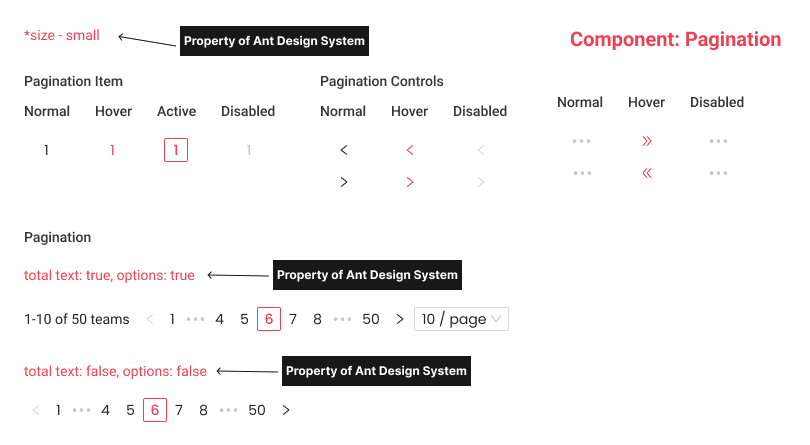
I referenced pagination properties while customizing components for better understanding for developers.
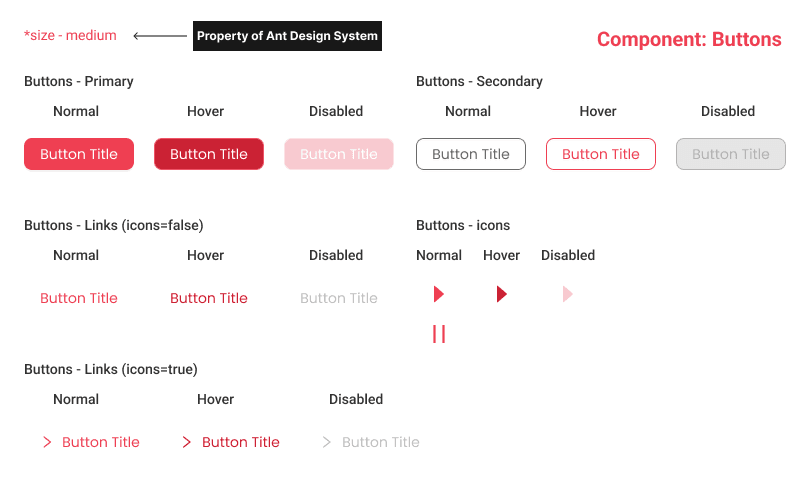
I customized Ant Design default buttons to match the brand colors.
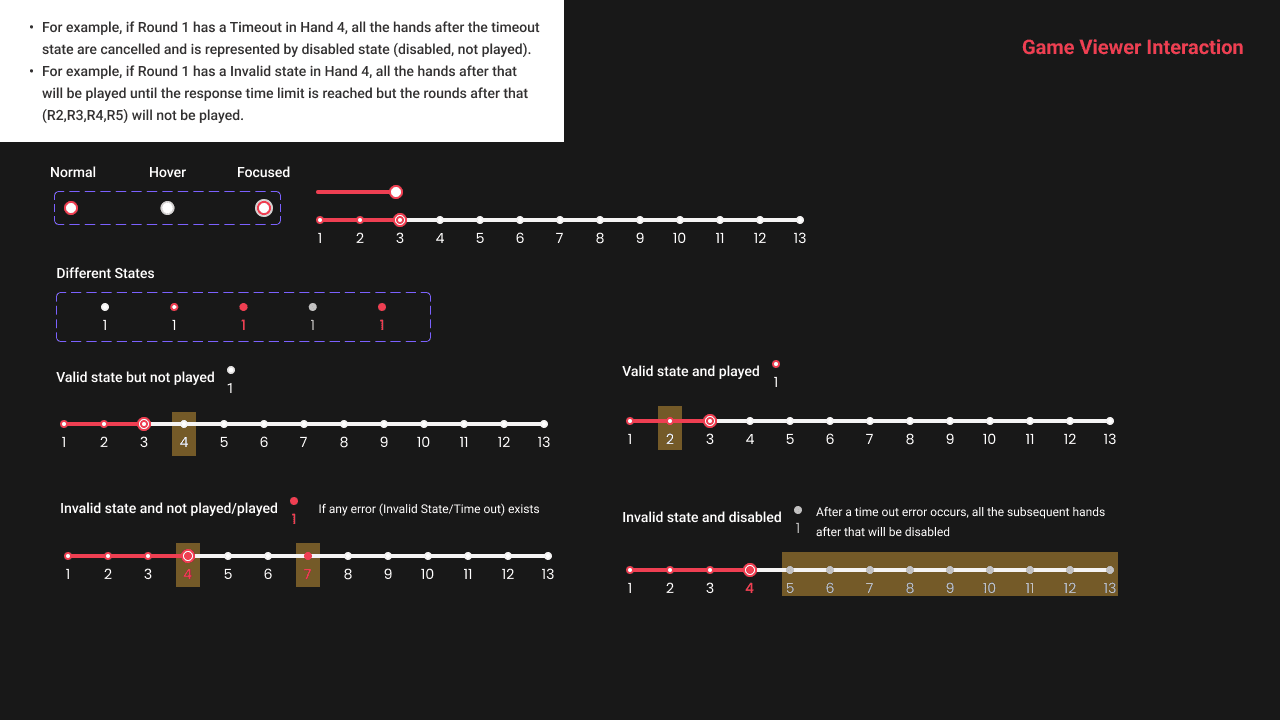
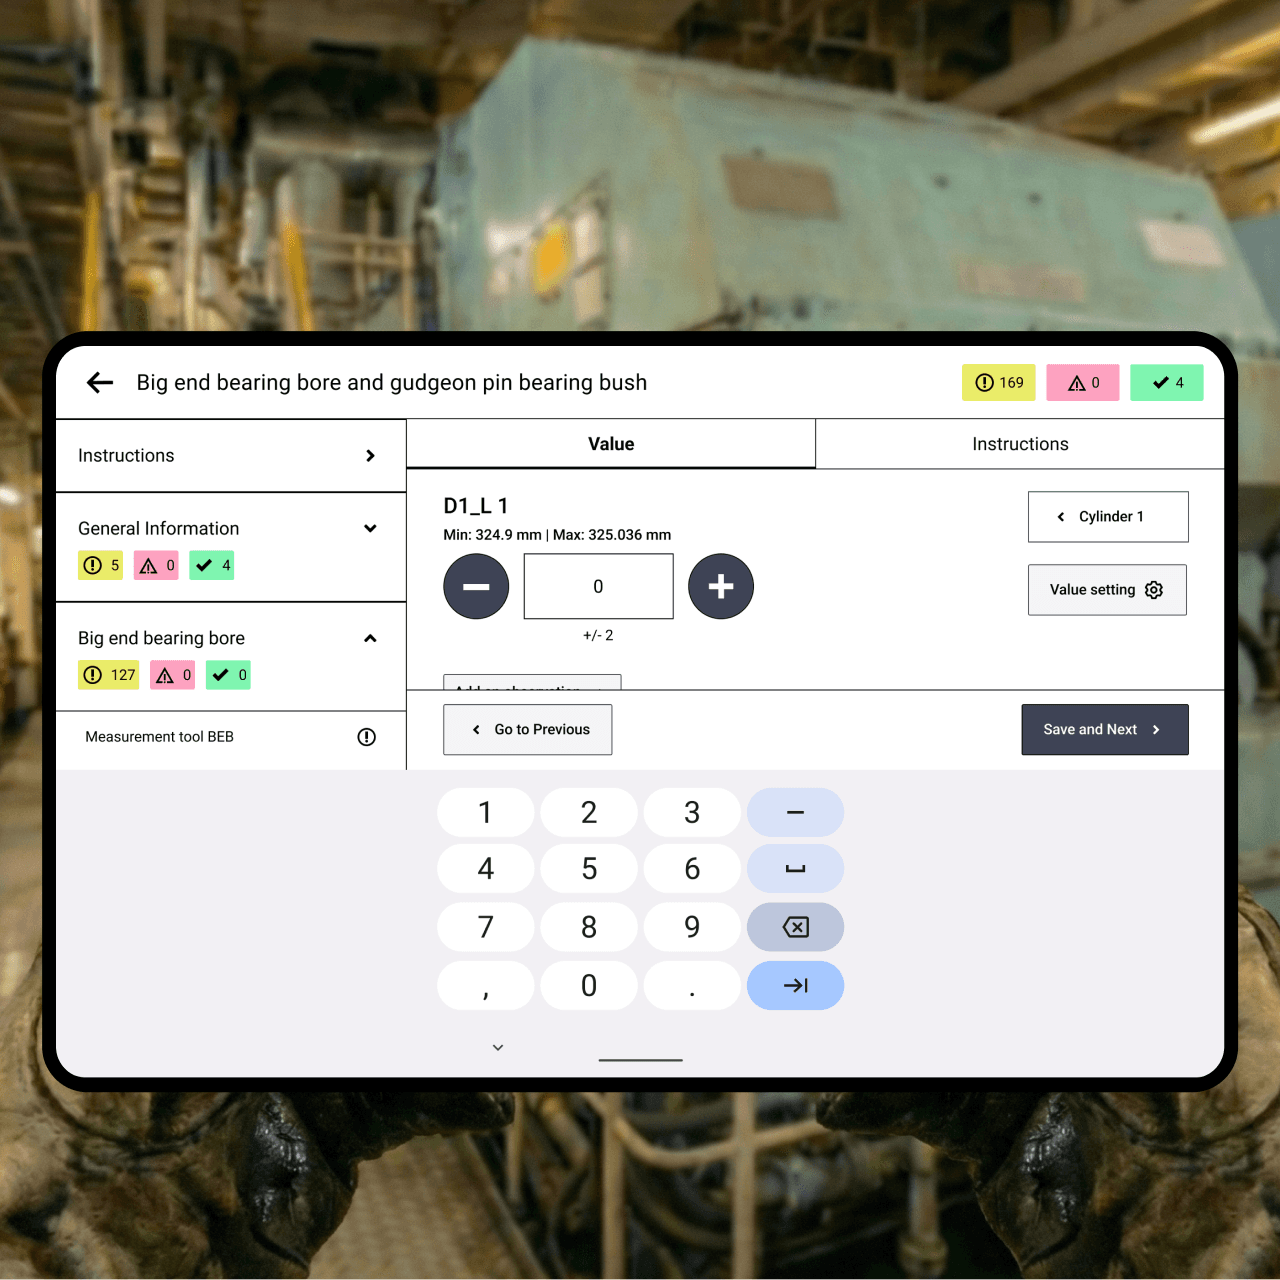
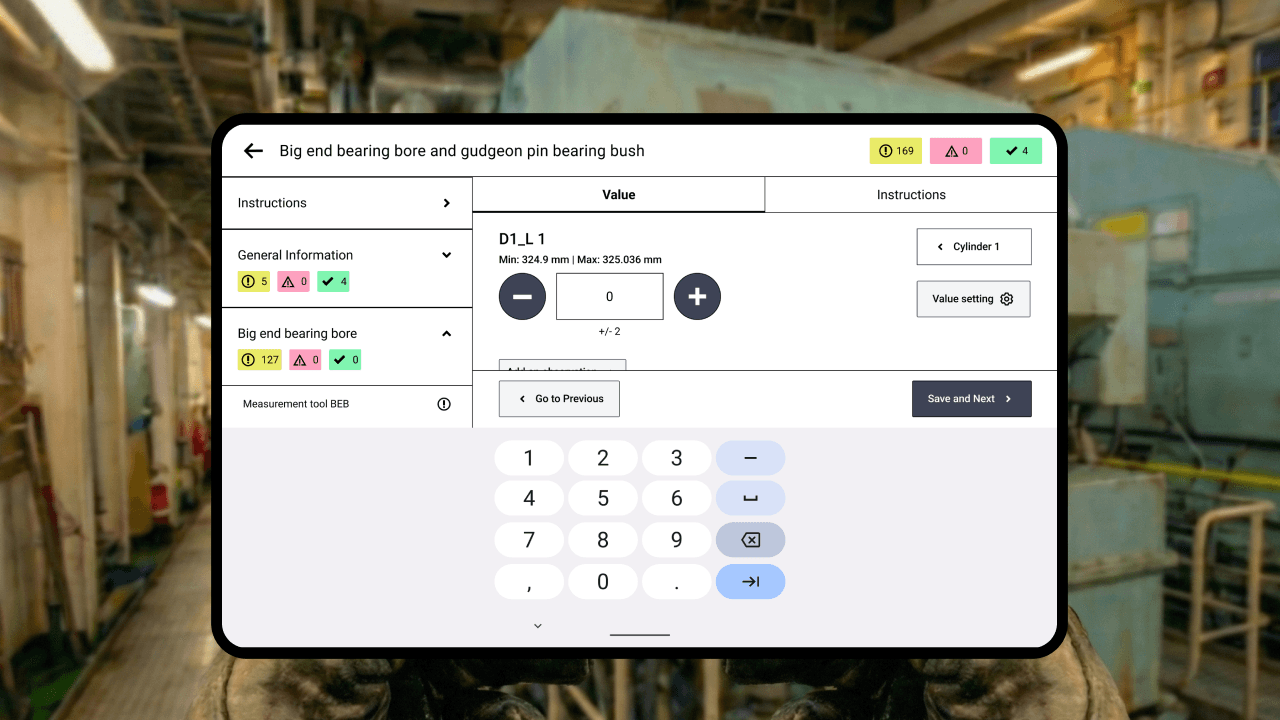
I tweaked the existing slider component to fit the Game Viewer Interaction needs.
How does it look like?
The Challenge Details Page
The page served as the initial home page where we explained the rules and all information about the challenge: what the participants were supposed to do, how the Leaderboard was decided, and how to submit the bot.
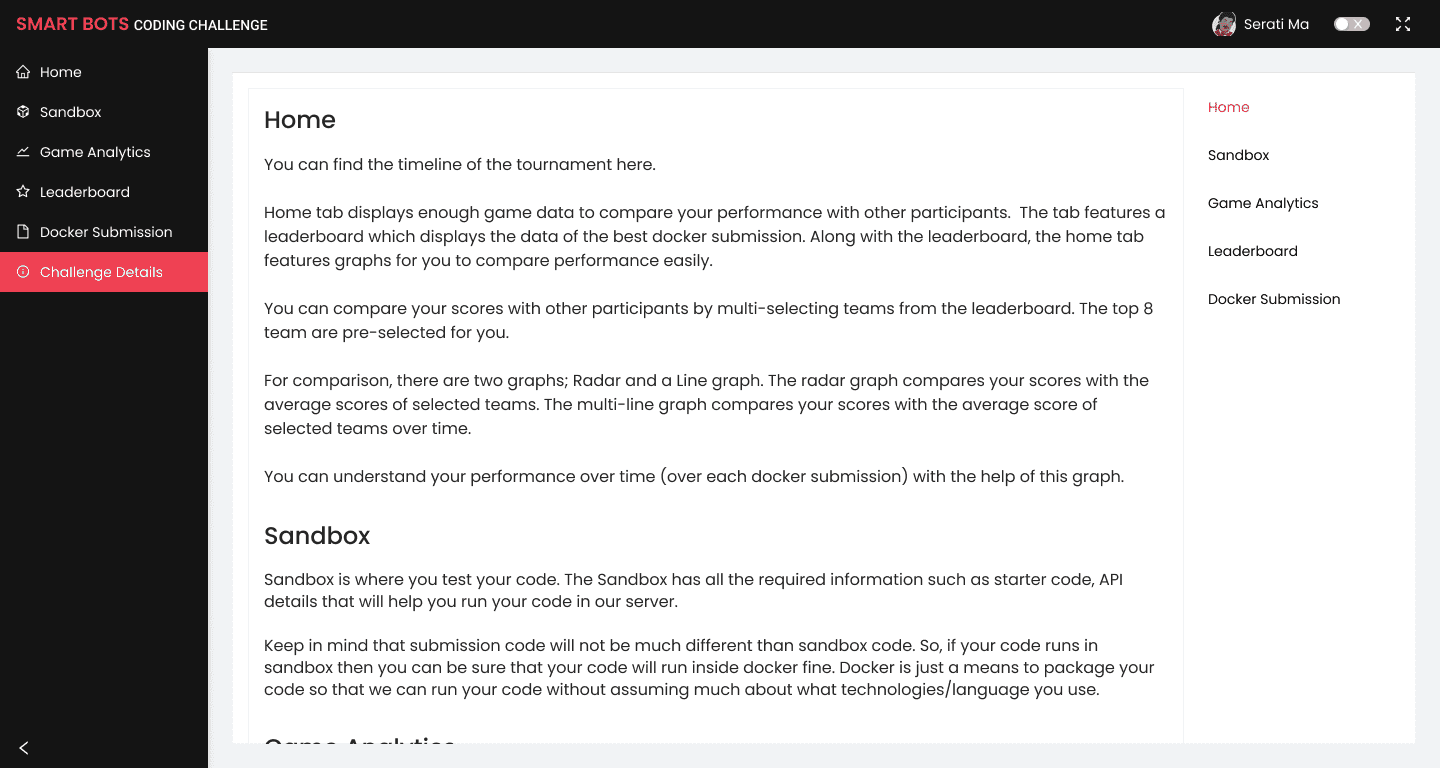
I collaborated with the content lead and we soon realized that the content was getting too long. I implemented an Anchor heading list on the right side to make it easy for users to find exactly what they were looking for.
The Sandbox Page
Participants came to this page to test their code. It contained API details to help participants run their code on our server. Our Developers wanted the participants to visualize how their bots played in the sandbox to verify if the APIs worked.
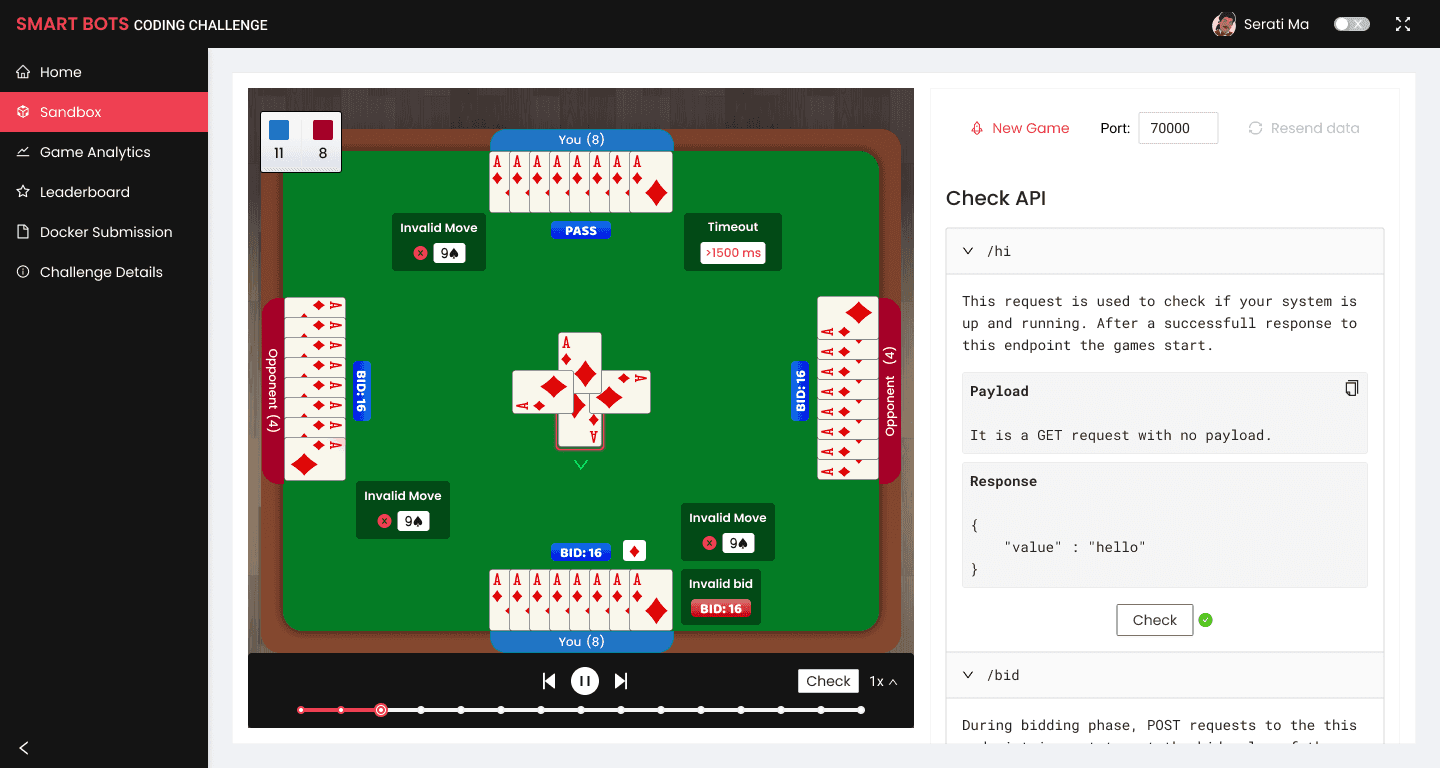
I reused the same components from the mobile game here (card deck, table, colors) for ease of development and to add subtle marketing for the main game.
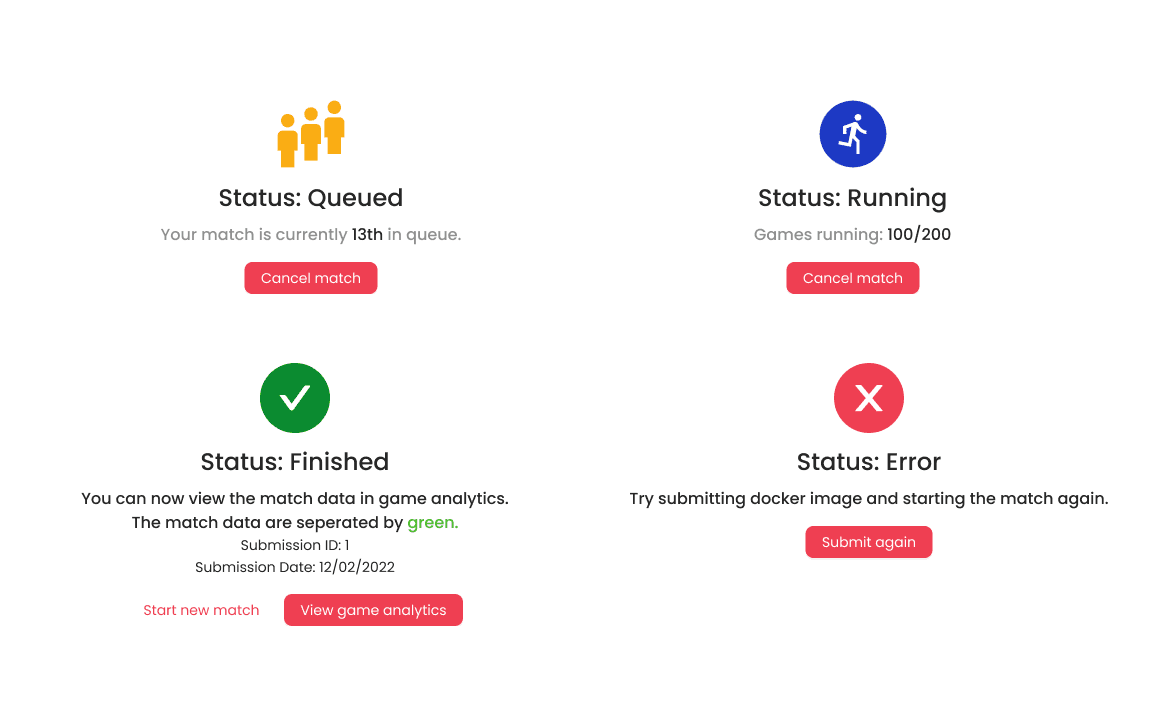
The Docker Submission Page
For security and flexibility, the technical team decided participants must submit a Docker image of their bots.
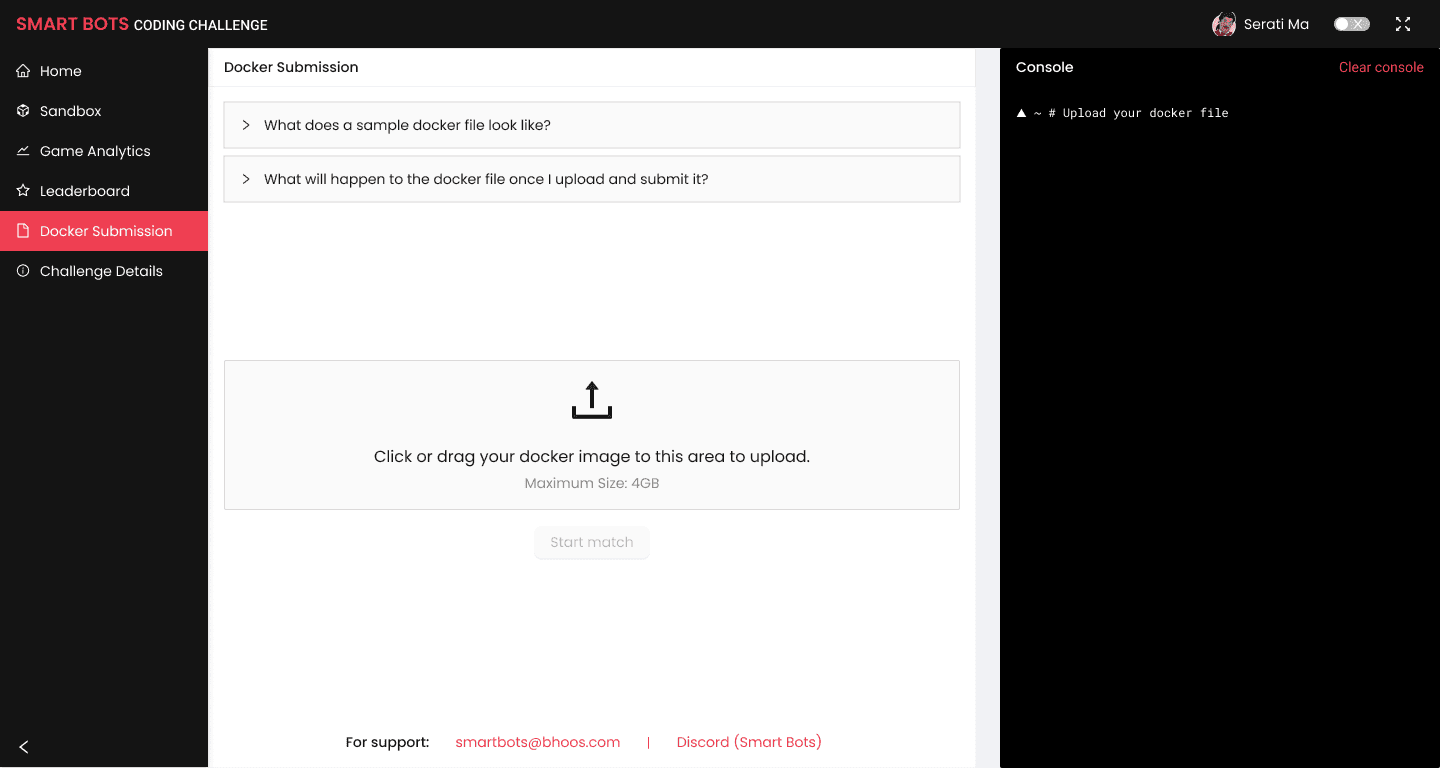
Since this was the most technical phase, many errors occurred. To make it efficient, we decided to display the Console View alongside the status for developer-friendly debugging. When that wasn't enough, we added direct Email and Discord support links on the page.
The Submission process had several phases, ending in "Status: Finished" if successful. I used a combination of icons and copy to explain every phase of the Submission process, including an option to Undo to ensure participants felt in control during high-stakes submissions.
The Game Analytics Page
This was the most critical page after submission.
Since participants would submit multiple times, and each submission played 100+ games for statistical significance, they needed a way to parse that data.
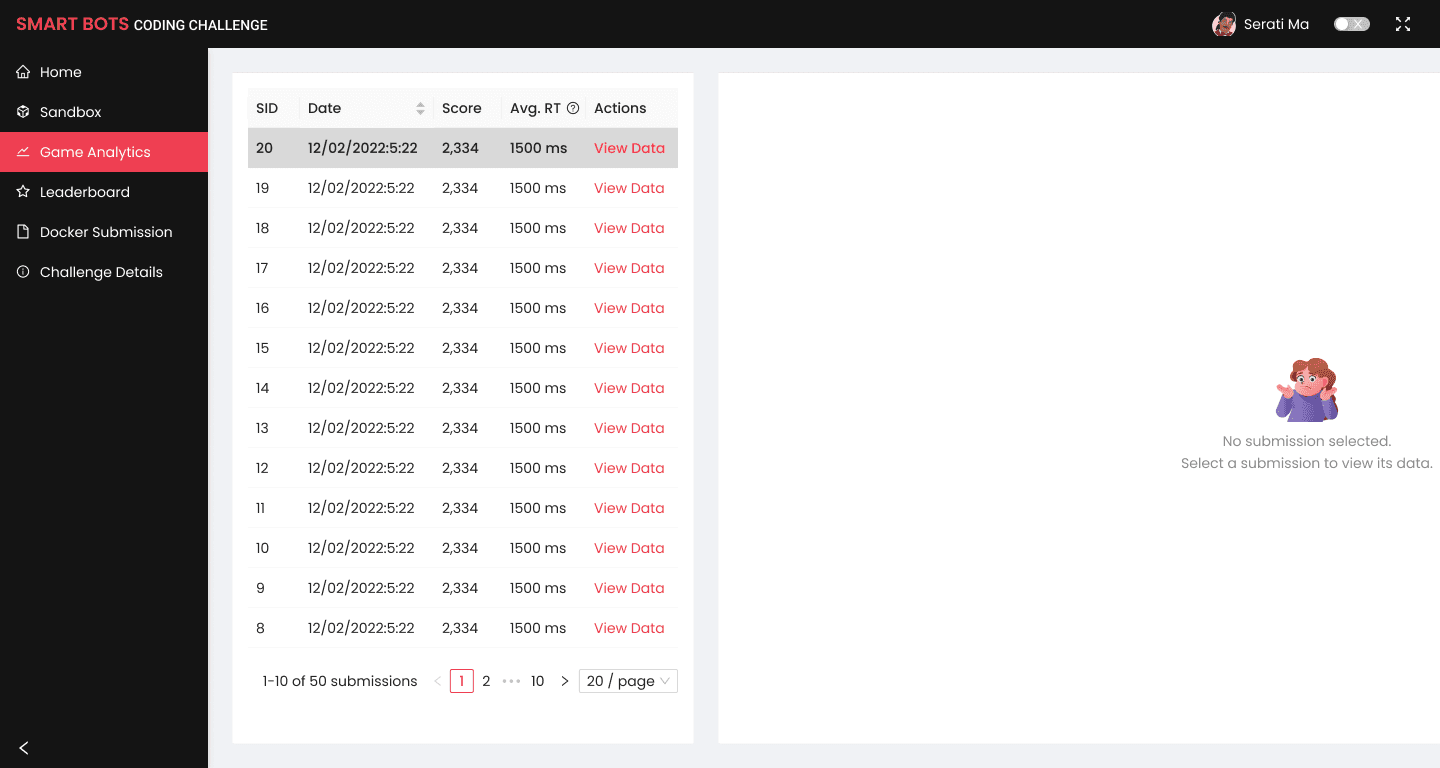
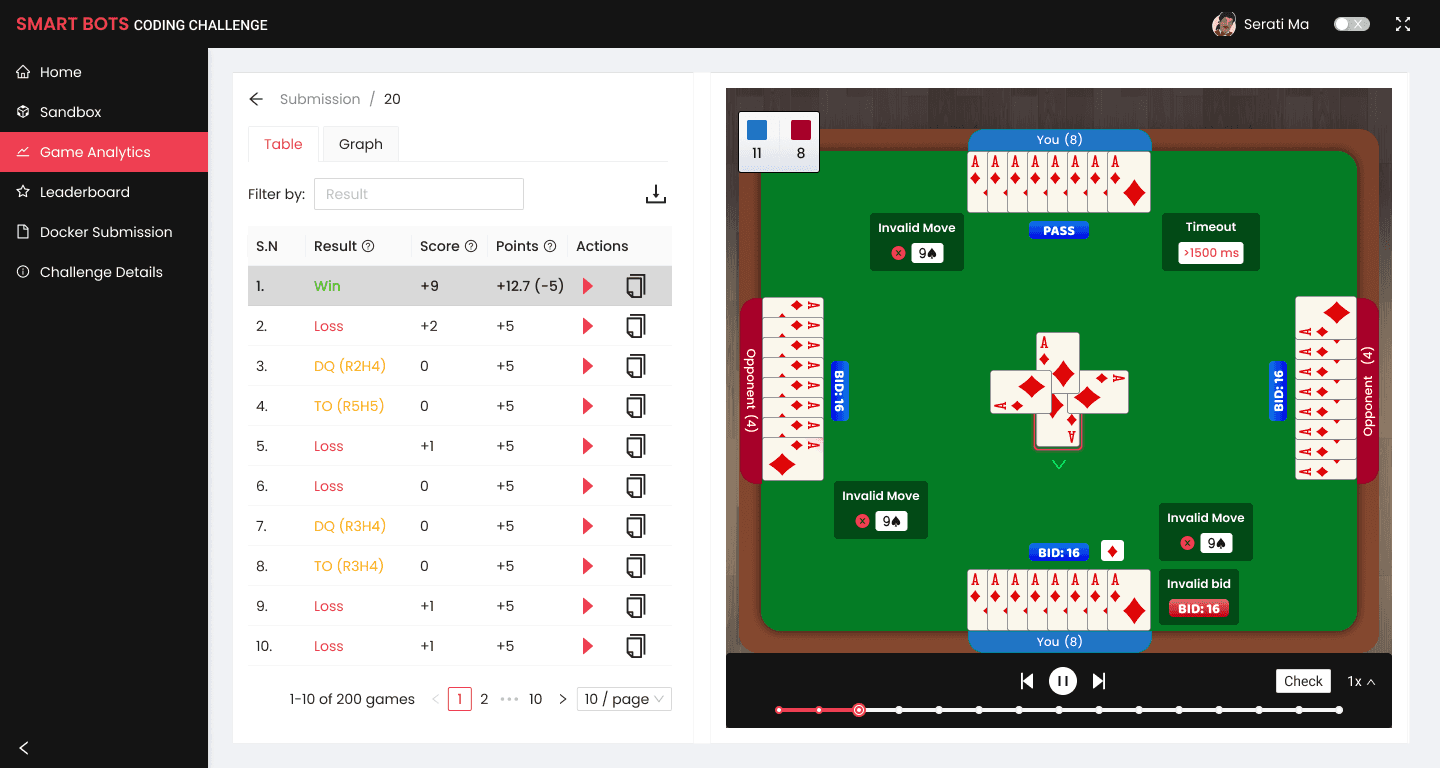
Here, the participant could see their submission data. And by see I mean, literally “see” how their bots played.
They could see visually in which round their bots failed and why. I also added a "Copy Data" feature for detailed analysis.
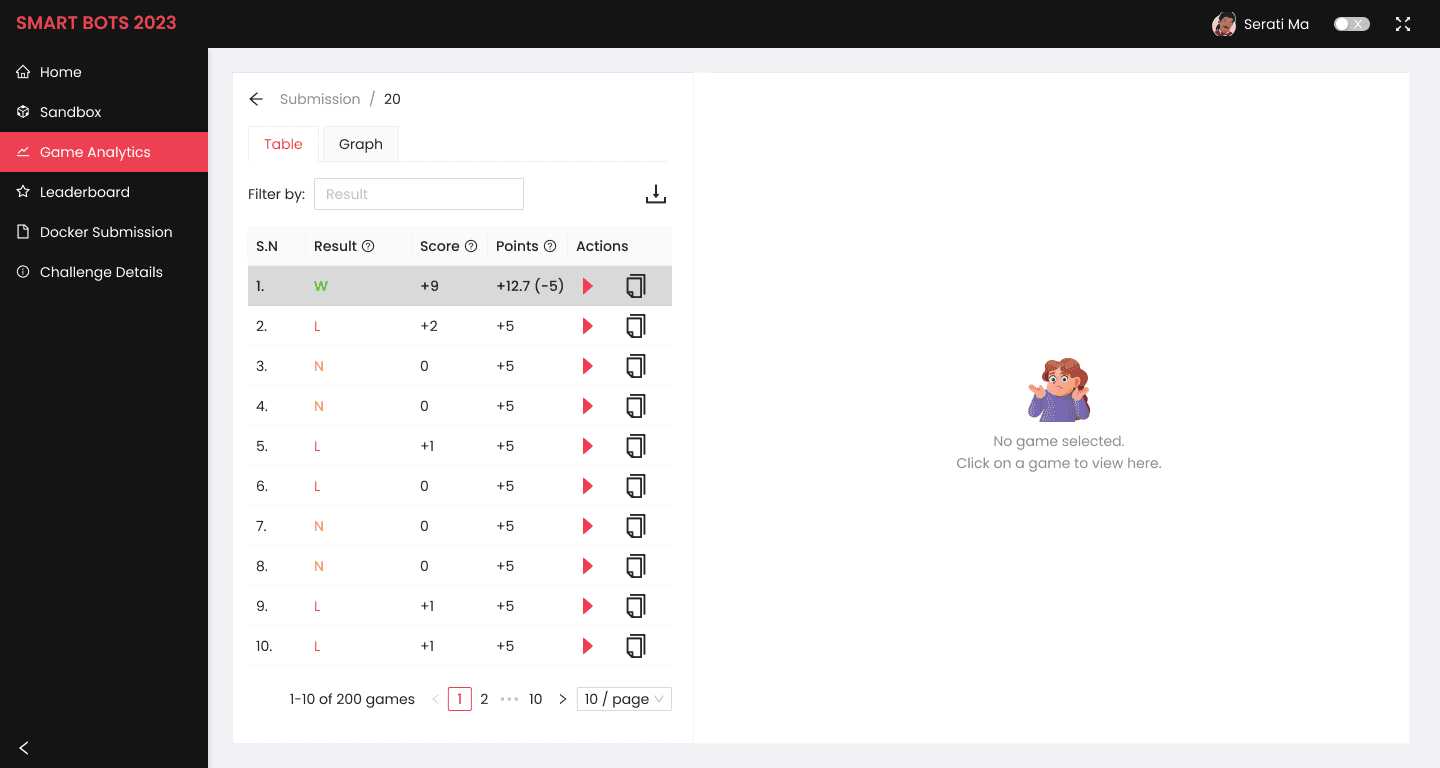
To instill some fun, I added a component from the game to show the system status in this tab. For example, the "No game selected" state was paired with a confused cartoon character icon from the mobile game to make the empty state feel friendly.
The Leaderboard Page
The Leaderboard displayed real-time rankings and detailed performance metrics to build competitive energy.
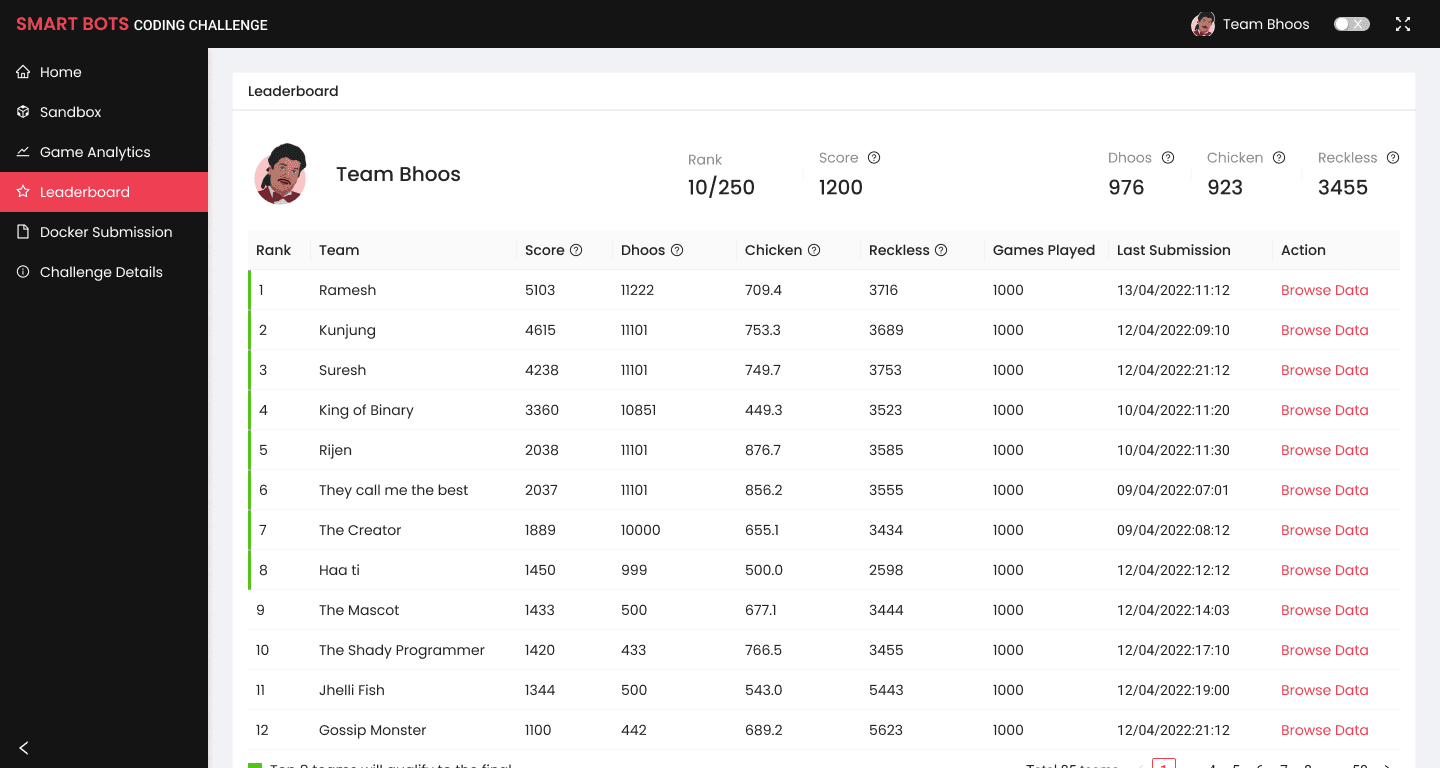
Since there was a large number of teams (90+), I decided to pin the participant's position on the header, showing their specific rank and score, while displaying the full Leaderboard as a list below.
The Home Screen
This screen brought everything together. It showed the latest Docker Submission status, the current phase of the competition (using a progress bar), and the leaderboard.
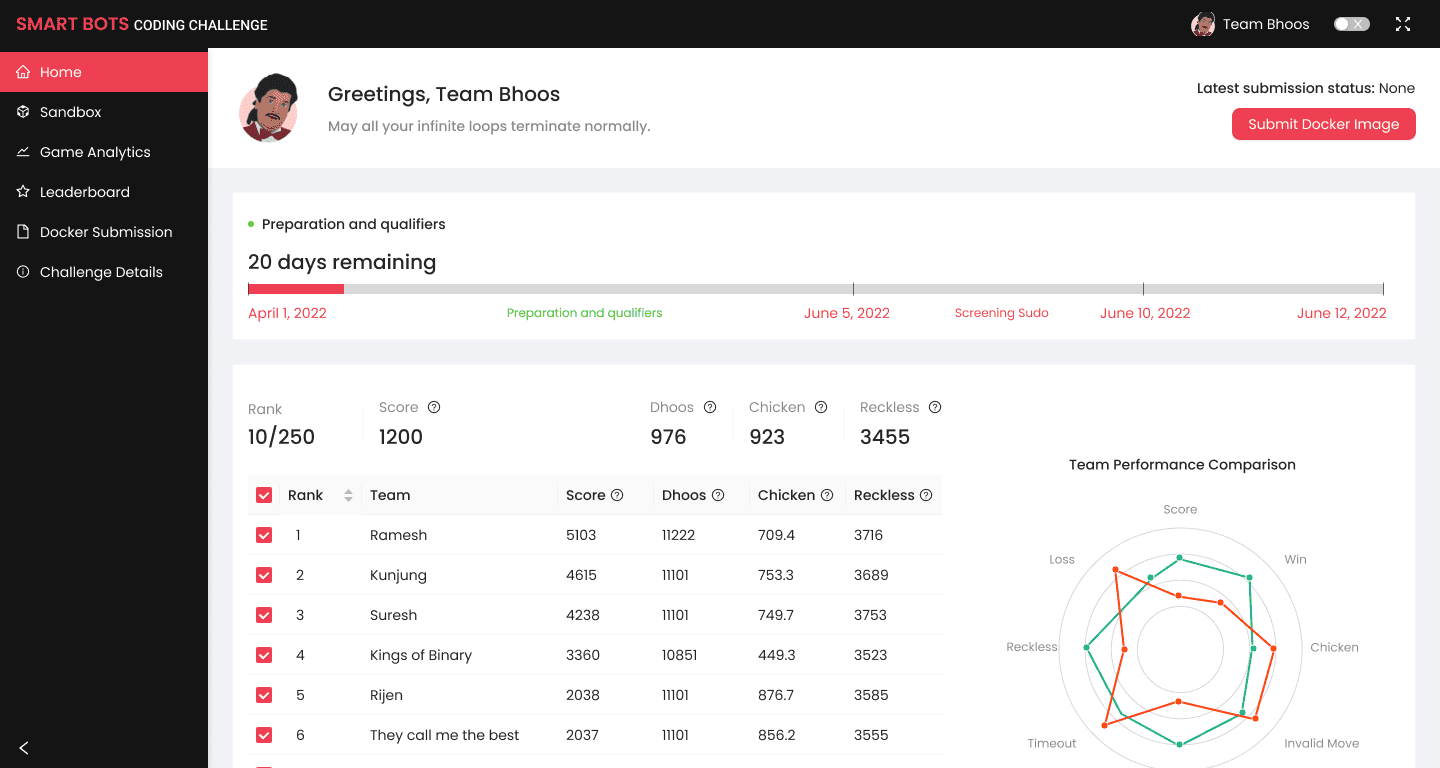
Our Developers wanted to allow participants to compare their bot's performance with others using three custom data points: Dhoos, Chicken, and Reckless . My task was to find a way to show these graphs in a user-friendly way.
The dashboard resulted in significant engagement and participation
The dashboard played a crucial role in the success of the first SmartBots Coding Challenge. Although analytics on dashboard usage were not collected, we observed consistent interaction from participants as they tracked their performance and rankings.
For the competition’s second year, the dashboard was reused with several refined features, resulting in significant engagement and participation:
What did I learn?
Conflicts are healthy (sometimes)
Working with developers extensively taught me how healthy conflicts can lead to better solutions.
Collaboration is key
Translating complex game data for users was a challenge, especially when you didn’t understand it yourself. I learned that close collaboration with the Content Writer was essential to turn technical metrics into clear, human-friendly insights.